

At a glance
- Industry: Mid-market B2B SaaS, compliance and workflow automation.
- Engagement: Six-week fixed-scope sprint, three-person team, 640 hours total execution.
- Starting point: A broken RAG prototype built on LangChain and OpenAI with no automated refresh, no validation, no observability, and no compliance posture.
- Outcome: Production RAG support assistant with 45% lower first-response time, 31% fewer Tier-2 escalations, 87% positive feedback rate, and a passed SOC 2 Type II audit that included the new system in scope.
Project background
Overview
A mid-market B2B SaaS company serving enterprise customers in the compliance and workflow automation space was struggling with growing support costs. Their Tier-1 support team handled over 2,000 tickets per month, with agents spending an average of 12 minutes per ticket searching through Confluence pages, Zendesk articles, and internal Markdown repositories to find answers to recurring technical questions. The company had already built an internal RAG chatbot prototype using LangChain and OpenAI, but it was unreliable: answers went stale when documentation changed, there was no way to measure accuracy, and the engineering team had no visibility into whether the assistant was helping or hallucinating.
Our team was brought in to take this prototype and deliver a production-grade RAG support assistant in a focused six-week sprint. The solution had three non-negotiable requirements: an automated data pipeline that keeps the knowledge base fresh without manual intervention, data quality validation at every stage to prevent bad content from reaching end users, and full observability so the support operations team could monitor answer quality, retrieval performance, and system health in real time.
Project goals
- Replace the prototype RAG assistant with a production-ready system backed by an automated, validated data pipeline.
- Build a structured ingestion and transformation layer using Snowflake, dbt, and Apache Airflow to consolidate content from Confluence, Zendesk, and Git-based documentation.
- Implement data quality gates at every pipeline stage using Great Expectations to prevent stale, incomplete, or malformed content from entering the vector store.
- Deploy end-to-end observability with Prometheus and Grafana covering retrieval accuracy, latency percentiles, token consumption, pipeline health, and user satisfaction signals.
- Reduce average first-response time for Tier-1 support tickets by at least 40% and decrease ticket escalation rate to Tier-2 by 25%.
Challenges
The core difficulty was not building a RAG system. It was building one that could be trusted in production with real customers. The client's existing prototype answered questions, but nobody could tell whether the answers were correct, current, or sourced from the right documents. Three specific challenges shaped our architecture decisions.
First, the knowledge base was fragmented across three platforms with inconsistent formatting, duplicate articles, and outdated content that had never been deprecated. Confluence pages referenced Zendesk macros that no longer existed. Internal Markdown docs contained version-specific instructions for software releases that had been superseded months ago. Ingesting this content without cleaning and validating it would have reproduced the same quality problems in the RAG responses.
Second, the prototype had no automated refresh mechanism. Embeddings were generated once during initial setup, and when documentation was updated, the vector store fell behind. This created a dangerous pattern: the assistant would confidently serve answers based on outdated content, and neither agents nor end users had any way to know the information was stale.
Third, the client operated under SOC 2 Type II compliance requirements. All content processing, embedding generation, and vector storage had to meet strict access control, encryption-at-rest, and audit trail standards. The prototype had none of this, running on a single developer's machine with API keys stored in environment variables.
Our approach
Solution architecture
We designed the system around three independent layers that communicate through well-defined interfaces: a data ingestion and transformation pipeline, the RAG inference engine, and a monitoring and observability stack. This separation ensured that each layer could be developed, tested, and scaled independently while feeding structured telemetry into a shared observability platform.
To move fast without cutting corners, we executed the delivery as three two-week sprints: (1) pipeline foundations and baseline retrieval, (2) quality validation and confidence calibration, (3) monitoring finalization and UI integration with the client's support tooling.
Data pipeline: ingestion, transformation, and quality validation
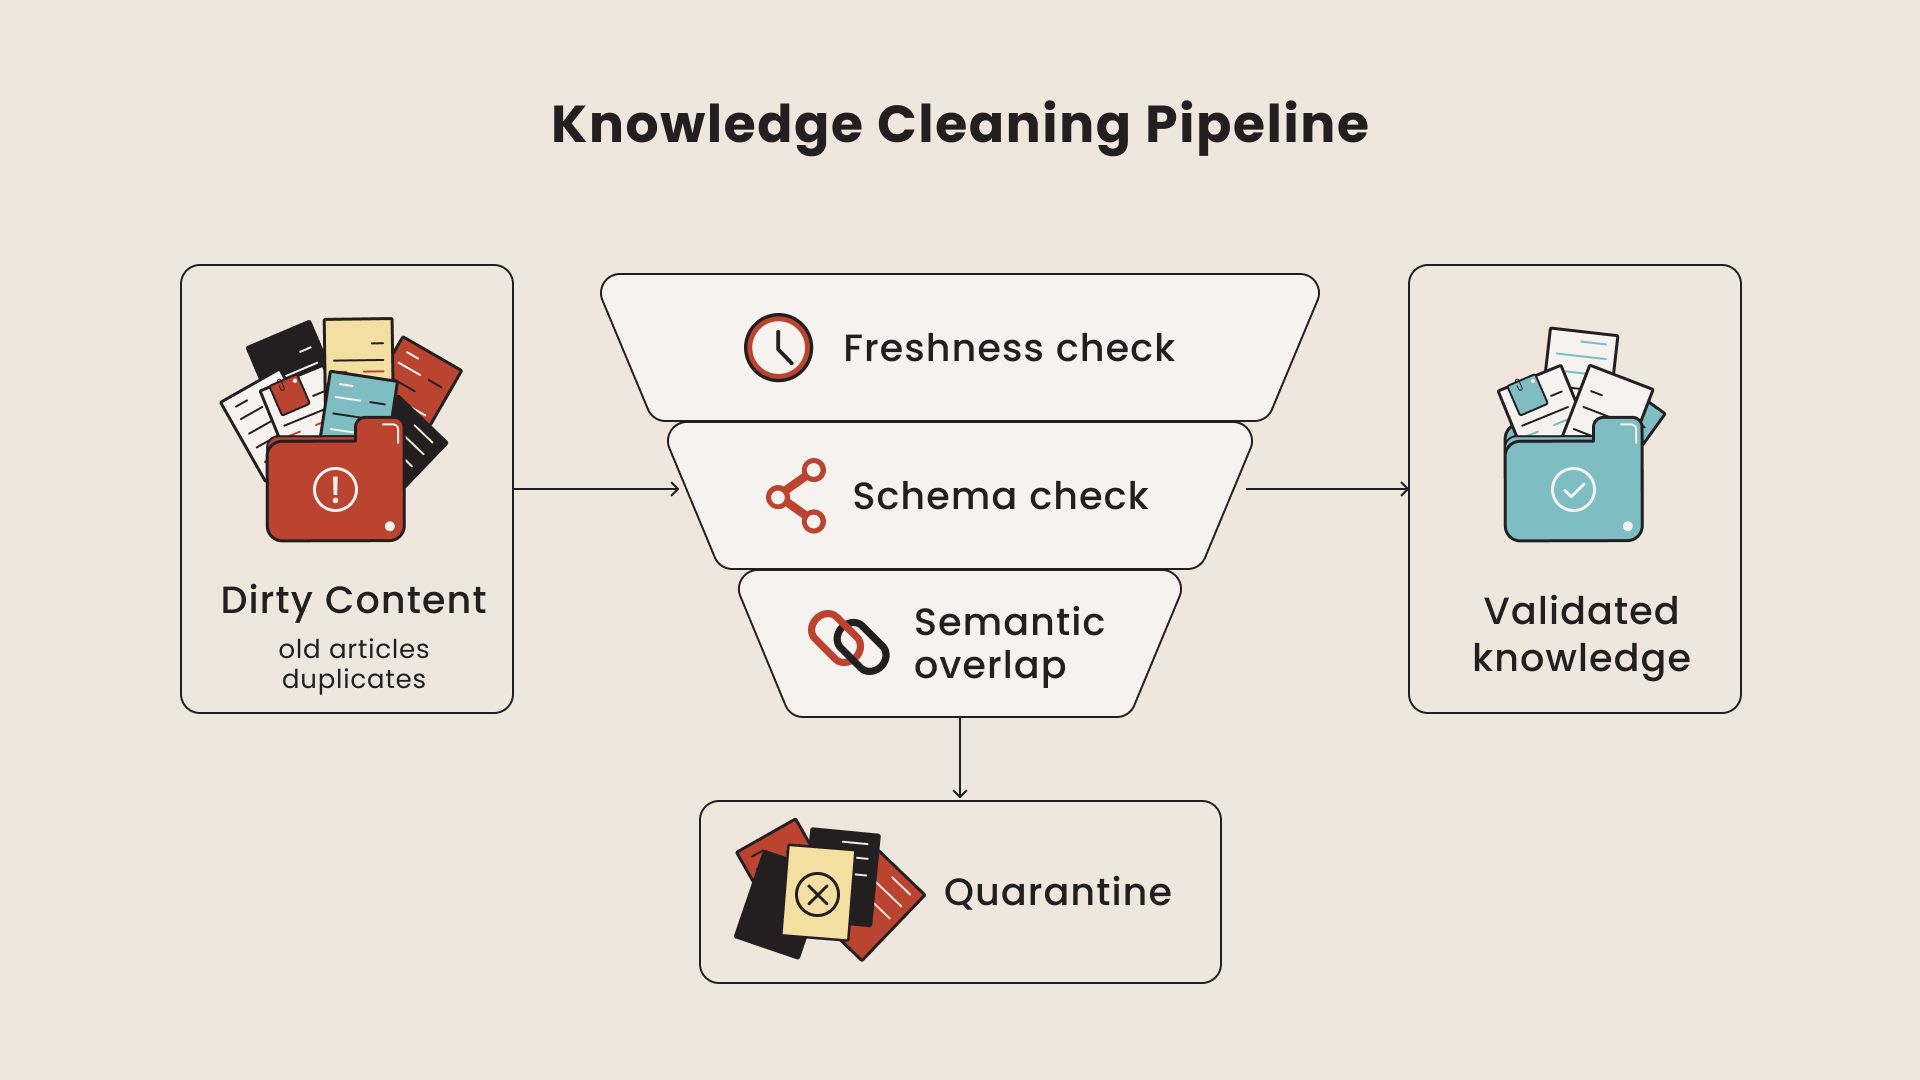
Apache Airflow orchestrates the entire content lifecycle through scheduled DAGs that run every four hours. Extraction jobs pull content from the client's Confluence API, Zendesk Help Center API, and Git repositories via webhooks. Raw content lands in Snowflake as a staging layer, where dbt models handle four transformation stages: cleaning (stripping HTML artifacts, normalizing whitespace, resolving broken links), deduplication (identifying near-duplicate articles across platforms using fuzzy matching), chunking (splitting documents into semantically coherent segments of 512 tokens with 64-token overlap), and metadata enrichment (tagging each chunk with source, author, last-modified date, product version, and content category).
Before any chunk moves downstream to embedding generation, Great Expectations runs a validation suite of expectations covering schema conformity, content freshness (rejecting chunks from articles not updated in the past 180 days unless explicitly flagged as evergreen), completeness (ensuring no chunks are empty or below minimum token threshold), and referential integrity (verifying that cross-references between chunks point to existing content). Only chunks that pass all validation gates proceed to the embedding step. Failed chunks are logged to a quarantine table with the specific expectation that failed, giving the client's documentation team a prioritized list of content that needs attention.
Validated chunks are vectorized using a fine-tuned sentence-transformers/all-MiniLM-L6-v2 model, chosen for its balance of retrieval quality and inference speed. Embeddings are stored in PostgreSQL with the pgvector extension, alongside the full chunk text and all metadata fields. The vector index is rebuilt incrementally, so only new or modified chunks trigger re-embedding, keeping pipeline execution time under 45 minutes for the full content corpus of approximately 8,000 documents.
RAG inference engine
The inference layer handles user queries through a retrieval chain built on LangChain with a custom reranking step. When a support query arrives (either from the end-user chat widget or from an agent's internal tool), the system encodes the query using the same embedding model, performs a cosine similarity search against pgvector to retrieve the top-20 candidate chunks, then applies a cross-encoder reranker (ms-marco-MiniLM-L-6-v2) to select the top-5 most contextually relevant chunks. These chunks, along with their metadata (source URL, last updated date, confidence score), are injected into the prompt context sent to GPT-4o for completion.
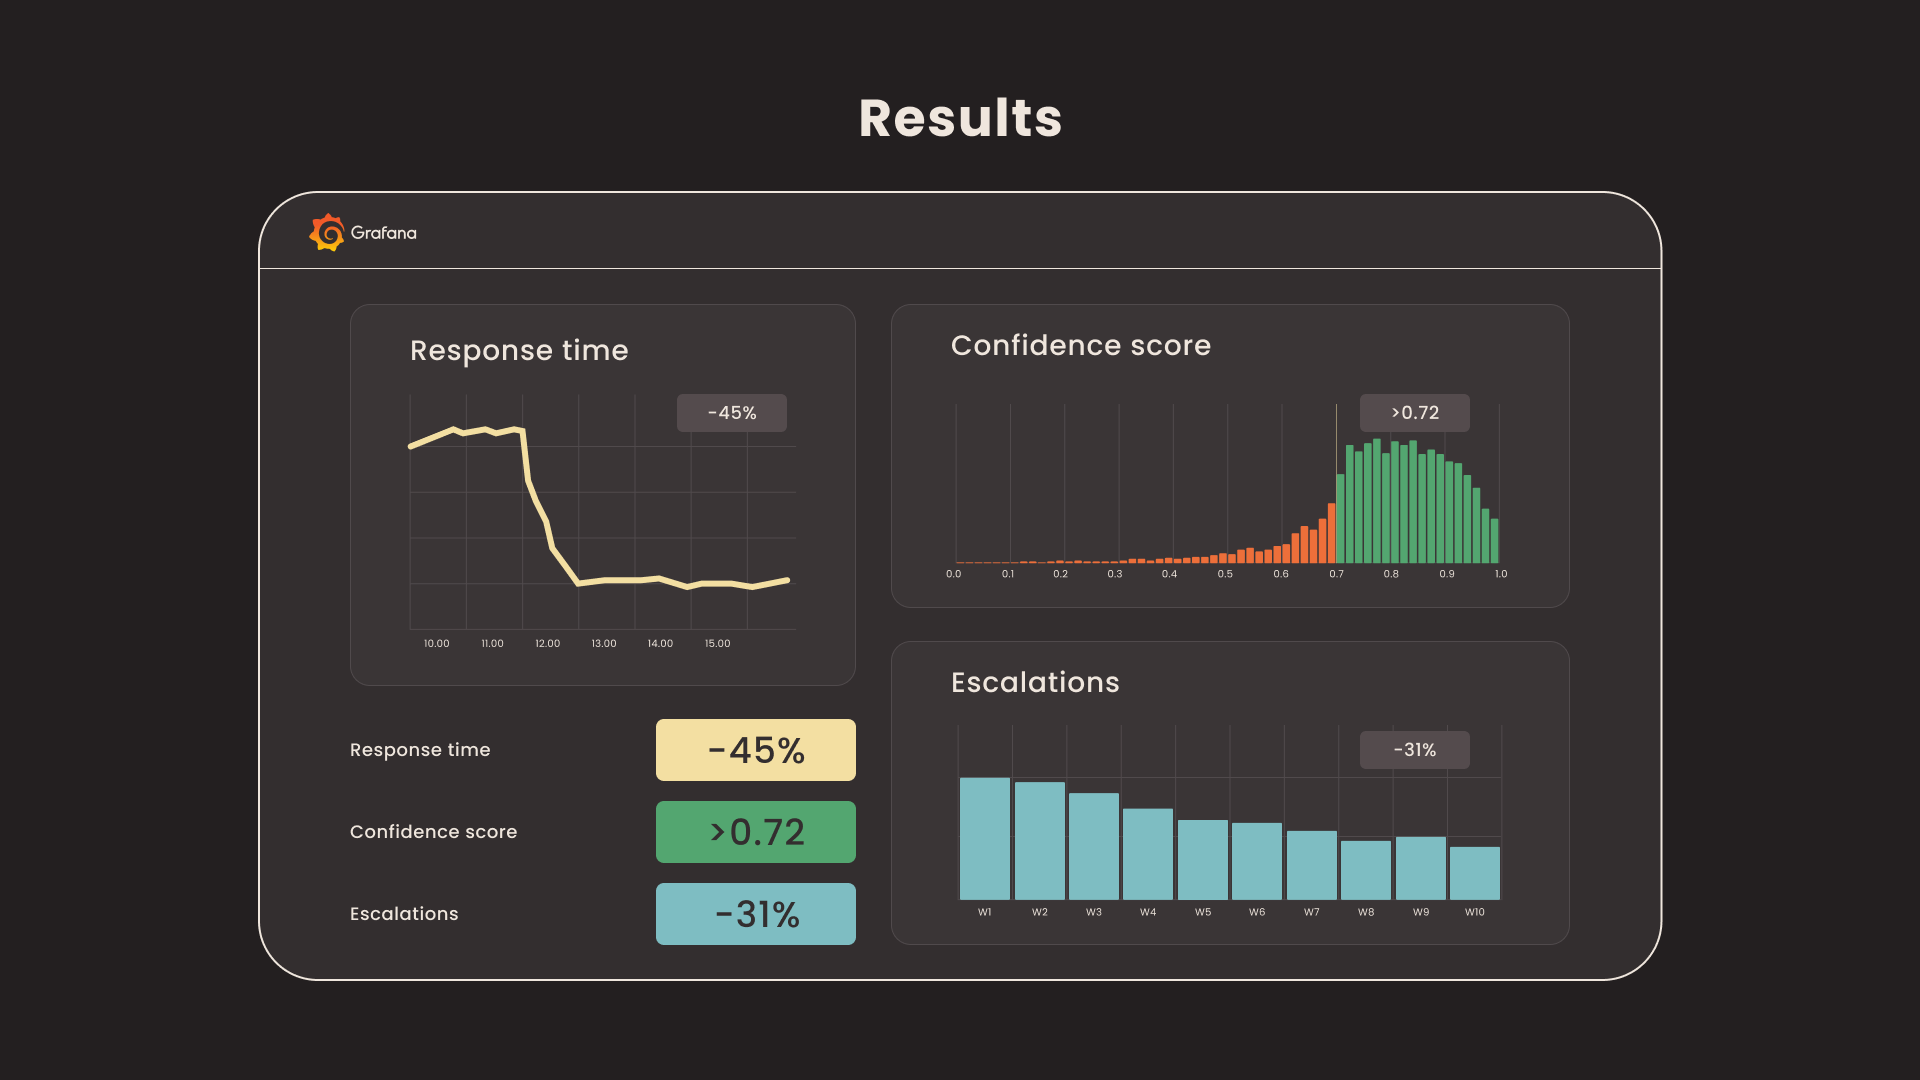
Every response includes inline source citations linked to the original documentation, so both end users and support agents can verify answers. The system also computes a retrieval confidence score based on the average similarity of the top-5 chunks. When the confidence score falls below a configurable threshold (set at 0.72 after calibration), the assistant explicitly states that it could not find a reliable answer and routes the query to a human agent, rather than risking a hallucinated response.
Observability and monitoring
Prometheus collects metrics from every component in the stack. For the data pipeline: Airflow DAG execution times, task failure rates, dbt model run durations, Great Expectations validation pass/fail ratios, and embedding generation throughput. For the inference layer: retrieval latency at p50, p95, and p99 percentiles, token consumption per query (both prompt and completion tokens), reranker processing time, and confidence score distributions. For user experience: thumbs-up/thumbs-down feedback rates, query-to-escalation ratios, and session abandonment rates.
Grafana dashboards provide the support operations team with four purpose-built views: System Health (pipeline status, infrastructure metrics), Answer Quality (confidence score trends, feedback ratios, escalation rates), Content Coverage (identifying topic areas where the assistant frequently falls below confidence threshold, signaling gaps in the knowledge base), and Cost Tracking (token usage trends, estimated monthly API spend). Alert rules trigger Slack notifications when retrieval accuracy drops below defined thresholds, when pipeline failures block content updates for more than 8 hours, or when token consumption exceeds daily budget limits.
Security and compliance
All data flows are encrypted in transit (TLS 1.3) and at rest (AES-256). Snowflake role-based access controls restrict who can view and modify content at each pipeline stage. The vector database runs in an isolated VPC with no public internet access. API keys and secrets are managed through HashiCorp Vault with automatic rotation. All user interactions with the assistant are logged with full audit trails, including the specific chunks retrieved and the confidence scores at the time of response, supporting the client's SOC 2 Type II evidence requirements.
Team
The project was delivered in 6 weeks by a compact team of three specialists, totaling approximately 640 hours of execution. A Solution Architect owned the technical design, security requirements, and stakeholder alignment. An AI/Data Engineer built the ingestion pipeline in Snowflake and dbt, implemented Great Expectations validation gates, and shipped the RAG retrieval and confidence calibration. A Backend/Integrations Engineer handled the Zendesk widget integration, internal tooling hooks, and the API layer. The short timeline was achieved by using proven, pre-built ingestion modules and standardized monitoring templates, while keeping strict quality and deployment discipline.
Tech stack
- Data sources: Confluence REST API, Zendesk Help Center API, Git webhooks.
- Orchestration: Apache Airflow with scheduled DAGs running every four hours.
- Warehouse and transformation: Snowflake (staging and storage), dbt (cleaning, deduplication, chunking, metadata enrichment).
- Data quality: Great Expectations with custom expectations for freshness, completeness, schema, and referential integrity.
- Embeddings: sentence-transformers/all-MiniLM-L6-v2, fine-tuned on the client's domain content.
- Vector store: PostgreSQL with the pgvector extension; incremental index rebuilds.
- Retrieval and reranking: LangChain chain with cosine similarity over pgvector and a ms-marco-MiniLM-L-6-v2 cross-encoder reranker.
- LLM: GPT-4o for completion, with prompt-level source citations and confidence-based routing.
- Observability: Prometheus for metrics, Grafana for four purpose-built dashboards, Slack alerts on threshold breaches.
- Security: TLS 1.3 in transit, AES-256 at rest, HashiCorp Vault for secret rotation, isolated VPC for the vector store, full audit logging for SOC 2 Type II evidence.
Results
The production RAG assistant went live within 6 weeks and demonstrated measurable impact on the client's support operations within the first 30 days of deployment.
- 45% reduction in average first-response time for Tier-1 support tickets. The assistant resolved common questions (account configuration, API usage, integration troubleshooting) without agent involvement, bringing average first-response time from 4.2 hours down to 2.3 hours.
- 31% decrease in Tier-1 to Tier-2 escalation rate. By providing accurate, source-cited answers to recurring technical questions, the assistant allowed Tier-1 agents to resolve issues they previously escalated due to unfamiliarity with the product's deeper features.
- 87% positive feedback rate on assistant responses (thumbs-up vs. thumbs-down), measured across the first 4,200 interactions.
- Under 1.8 seconds p95 retrieval latency end-to-end, from query submission to rendered response, including the reranking step.
- Content freshness SLA met consistently: documentation updates are reflected in the assistant's responses within 4 hours of publication, with zero manual intervention required.
- Hallucination containment: the confidence-based routing mechanism successfully diverted low-confidence queries to human agents during the first month, with no reported instances of the assistant serving fabricated information that reached end users.
- SOC 2 Type II audit passed with the RAG assistant infrastructure included in scope, with no findings related to the new system.
The Grafana dashboards became a daily operational tool for the support leadership team. The Content Coverage view identified 14 topic clusters where the assistant consistently scored below the confidence threshold in the first two weeks, which the client's documentation team used to prioritize new article creation. Within 60 days of launch, content coverage had expanded to address all identified gaps, further improving the assistant's deflection rate.
FAQ
Why pgvector instead of a dedicated vector database like Pinecone or Weaviate?
The client's data was already in PostgreSQL for compliance reasons. Adding pgvector kept everything inside the existing security perimeter, eliminated a new vendor procurement cycle, and avoided a second backup and DR strategy. For 8,000 documents with incremental updates, pgvector retrieval latency stayed well under the 1.8-second SLA. We would revisit this decision past roughly 500,000 chunks or if multi-tenant isolation became a requirement.
How did you handle hallucinations in production?
Two layers. First, the confidence threshold at 0.72: when the average similarity of the top-5 reranked chunks falls below that value, the assistant declines to answer and routes the query to a human agent rather than risking a fabricated response. Second, every answer includes inline source citations linked back to the original documentation, so a human can verify the answer in one click. The thumbs-down feedback signal also feeds back into a weekly content review where flagged answers are inspected by the support ops team.
What was the hardest part of the six-week timeline?
Data quality discipline. It would have been faster to skip Great Expectations and ingest content directly, and the demo would have looked similar. The bet we made was that production trust depends on validation gates that fail loudly. That bet paid off during the SOC 2 audit, where the auditors specifically asked to see the validation pipeline logs and rejection records.
Could this architecture work for a smaller team or budget?
Yes, with substitutions. Replace Snowflake with PostgreSQL plus a lighter ETL like Prefect or even GitHub Actions for scheduled jobs. Replace Apache Airflow with cron-driven scripts for low-volume content. Keep Great Expectations (it is free and the value is disproportionate). Keep pgvector. The end-to-end cost can drop by roughly 70% with these substitutions while preserving the validation and observability principles.
What is next for the system?
Two roadmap items. First, a conversation-level memory layer so multi-turn support sessions retain context without re-retrieving from scratch each turn. Second, an automated content gap detector that translates frequently-rejected queries into draft documentation tickets in the client's docs platform, closing the loop between user demand and content coverage.
