
Turning a Zoo of Public Soil Data into One Nationwide Geospatial Database
A US soil-intelligence startup needed a soil data platform built on land data that already existed in public, but only as a zoo of incompatible formats. We carried out the geospatial data engineering to unify dozens of non-standard public sources into one standardized, parcel-keyed database covering every US state, then built the analysis, soil-to-fertilizer matching and recommendation layer on top of it. For confidentiality we describe the engagement without naming the company or the people involved.
Key Takeaways
- Unified dozens of non-standard public sources (USDA, universities, public registries) into one standardized geospatial database.
- A roughly 250 GB nationwide reference database (vector and text together) keyed to land parcels.
- Parcel-level soil analysis matched to fertilizer compositions, with sub-field application recommendations.
- A multi-stakeholder SaaS platform: farmer, cooperative and manufacturer dashboards, plus in-platform ordering.
The client is a US agritech and soil-intelligence startup founded by people with agronomy and analytics backgrounds rather than an in-house engineering team. Their end users are farmers, cooperatives that manage many fields at once, and fertilizer manufacturers. The first version of the idea was a layer between the farmer and the state: helping growers complete public yield-grant paperwork correctly, using data pulled from public sources. The deeper they went, the clearer it became that the real product was the data itself, and that nobody had yet turned it into something you could query.
The Challenge: Decision-Grade Answers Trapped in a Zoo of Incompatible Public Data
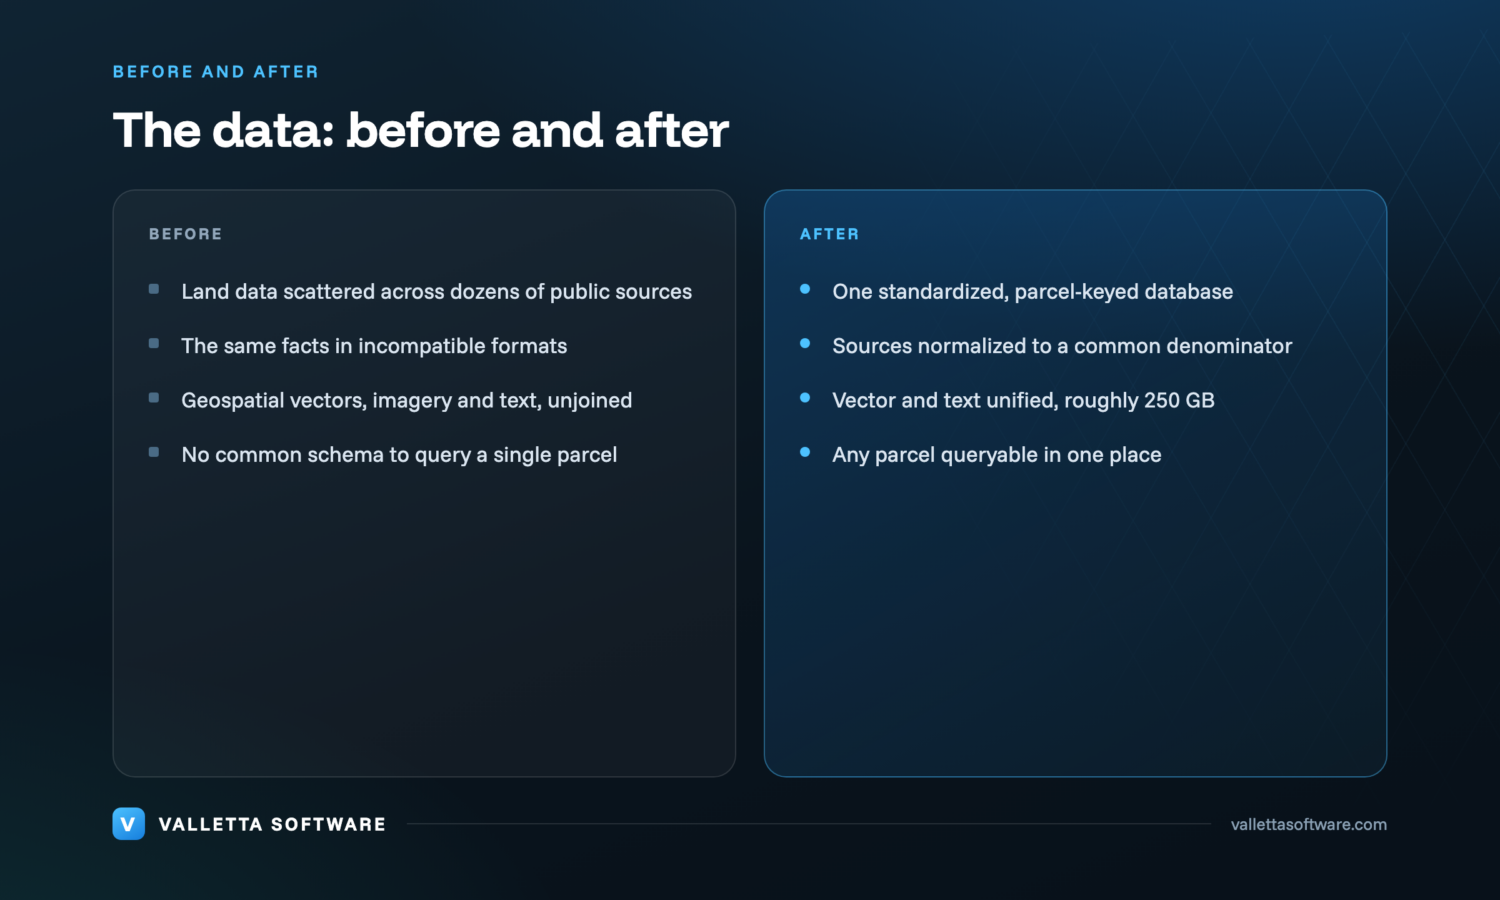
To help a farmer, you first have to know the land. What are the exact coordinates of the parcel? What is the history and quality of the soil? How does water move across it, and where are the lowlands and the high ground? What has it yielded before? Every one of those facts exists somewhere in public data, published by the US Department of Agriculture, by universities, and by state and public registries. The problem is not that the data is missing. The problem is that it is everywhere, and no two sources describe the same thing the same way.
This is the zoo. The same underlying fact about a piece of land shows up in dozens of incompatible shapes: different file formats, different units, different identifiers, different levels of precision, and a mix of data types that rarely live together comfortably. Geospatial vectors, imagery and plain text all describe one parcel, but they arrive from separate systems with no common schema to join them. Without that common denominator, there is no analysis to build, because you cannot reliably line up soil quality, terrain and yield for the same parcel.
On top of the data problem sat an organizational one. The founders understood the agronomy and the market, but they had no in-house technical team, no architecture, and no ingestion process to turn this raw public material into a dependable asset. They needed a partner who could do the geospatial data engineering and the data standardization, then build a product on top of the result.
- Critical land data scattered across many public sources (USDA, universities, state records)
- The same facts in incompatible formats: a data zoo with no common schema
- Mixed data types in one problem: geospatial vectors, imagery and text
- No in-house technical team, architecture, or ingestion process on the client side
The Approach: Standardize First, Then Build the Decision Layer on Top
We ran the work in two phases, because the order matters. Trying to build farmer-facing features on top of unstandardized data would have meant rebuilding them every time a new source arrived. So the first phase was pure data engineering: ingest the public sources, normalize them to a single common denominator, validate the result, and assemble a reference database keyed to the land parcel rather than to whichever system the data happened to come from.
Only once that foundation existed did we build the product on top of it: a portal where a user selects a parcel on a map, sees everything the database knows about it, checks and corrects the details, and saves the result. The reference database is the strategic asset, and the application is a window onto it.
Two strategic decisions shaped the build. First, one unified reference database as the single foundation, so every later feature reads from the same standardized, parcel-keyed source instead of re-solving the standardization problem. Second, coverage that scales: we started with a reference database for a handful of states to prove the ingestion and normalization pipeline, then extended the same process to all US states. Because the pipeline is hardware-agnostic and geography-independent, widening coverage is a matter of feeding it new sources, not rebuilding it.
The Solution: A Standardized Geospatial Database and a Soil-to-Fertilizer Platform
- A standardized geospatial reference database. Ingestion and normalization of dozens of non-standard public sources into one queryable, parcel-keyed database, roughly 250 GB of vector and text data, built from scratch. This is the GIS database that everything else depends on.
- Parcel-level soil and land analysis. For a selected parcel, the platform pulls and verifies everything known about it, down to sub-field zones, so a user can see that some parts of a field need work while others are fine, rather than treating the whole parcel as one average.
- Soil-to-fertilizer matching and a recommendation engine. The platform matches a parcel's needs against the chemical compositions of fertilizers from multiple producers, recommends how much to apply and where, lets the user compare options by price and delivery, and supports ordering inside the platform.
- Multi-stakeholder dashboards. Separate dashboards for farmers, for cooperatives managing many fields, and for fertilizer manufacturers, plus built-in lead tooling so manufacturers can reach the right growers. Each role sees the platform through its own lens, on the same data.
A few data and design principles held throughout the build:
- The unique reference database is owned by the client, not locked inside a vendor platform.
- Integrations to public sources are built to be repeatable, so refreshing and extending the data is routine rather than a rescue mission.
- The approach is hardware-agnostic and geography-independent, so the same analysis and recommendation layer can sit on top of new regions, sources or sensors.
The hard part was not the app. It was turning a zoo of incompatible public datasets into one database you can actually make decisions on.
The Results: A Unique Nationwide Data Asset and a Live Platform
The engagement produced two things that did not exist before: a unique, standardized geospatial database that the client owns, and a working platform built on top of it. The data zoo became a single decision-grade source, and the questions that used to require manual cross-referencing across many public systems can now be answered for a parcel in one place.
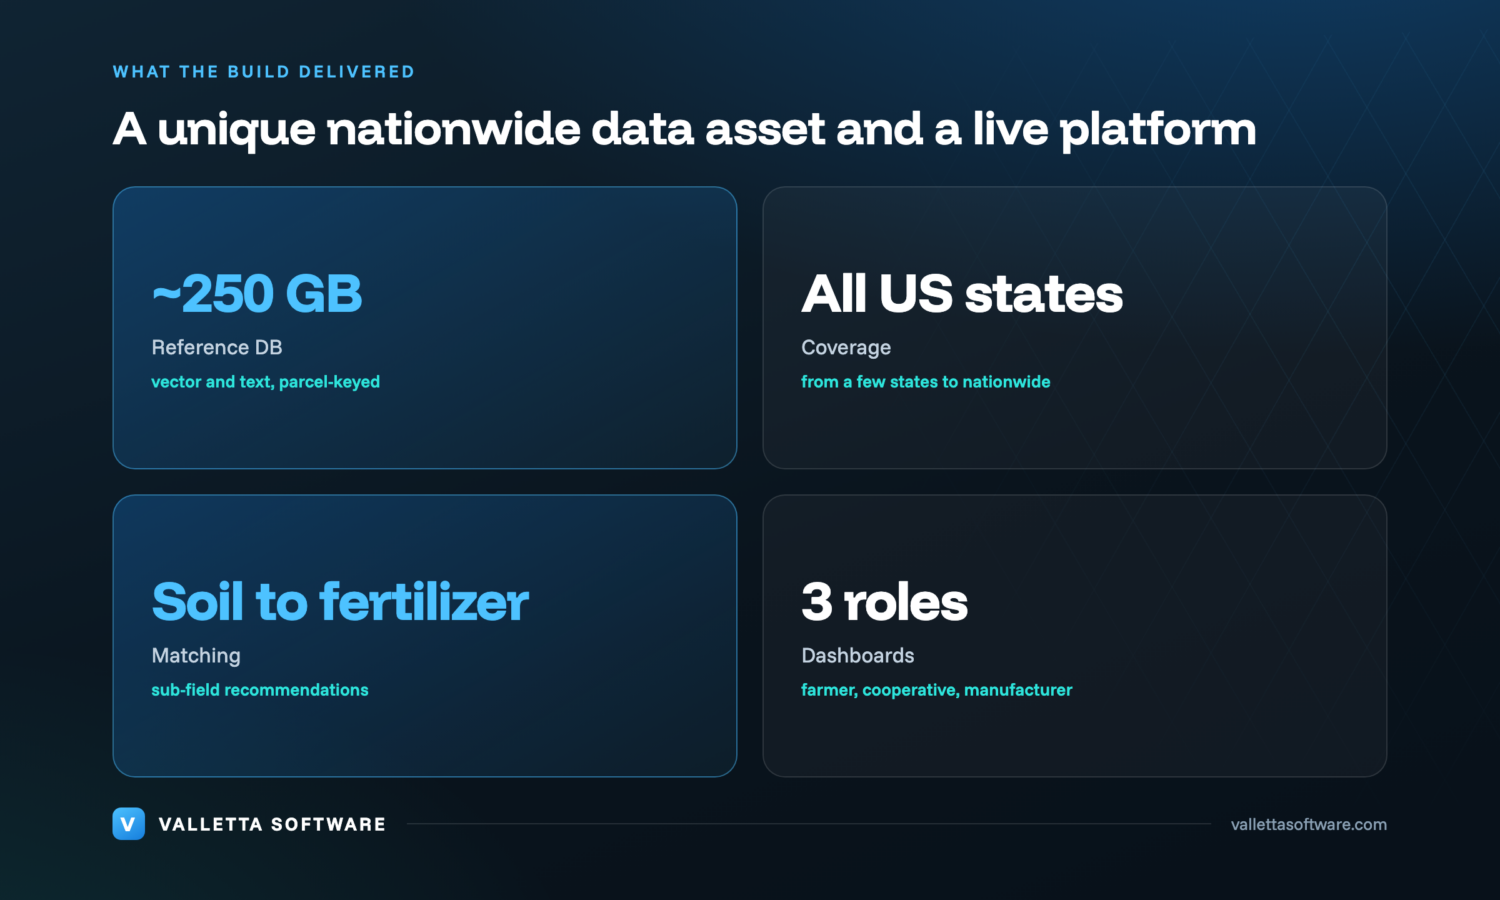
- A unique, standardized geospatial database of roughly 250 GB covering all US states, owned by the client.
- A working SaaS platform, in beta, connecting farmers, cooperatives and fertilizer manufacturers.
- Parcel-level and zone-level fertilizer recommendations, with in-platform ordering.
- A foundation built to extend to new regions and sources without rebuilding the core.
The platform is in beta with test manufacturers, and the data asset is already the kind of thing that is hard for a competitor to reproduce. A natural next step, letting farmers upload their own soil-test results to enrich the parcel record, is on the roadmap rather than shipped. For more engagements like this, browse our success stories.
Frequently Asked Questions
Can you turn messy, multi-source public data into one standardized database?
Yes. We specialize in ingesting non-standard sources, normalizing them to a common schema, validating, and building a queryable database, including large geospatial datasets that mix vector, imagery and text.
Can you build soil-data analytics and recommendations on top of existing sensors or hardware?
Yes. Our approach is hardware-agnostic and geography-independent. We add the analysis and recommendation layer on top of whatever data sources or devices already exist.
How do you handle geospatial data at scale?
We built and operate a roughly 250 GB parcel-keyed geospatial reference database, with sub-field-level analysis and matching, designed to extend to new regions.
Sitting on Fragmented Geospatial or Soil Data?
We have hands-on experience turning scattered, non-standard data into a single decision-grade asset, then building the analytics and recommendations on top. If you have geospatial, soil or yield data spread across incompatible sources, tell us what you are trying to decide with it and we will show you how we would unify it.
Get a free consultation: vallettasoftware.com/contact