Why technical debt deserves a seat at the boardroom table


If you still treat technical debt as an engineering concern, you are reading the wrong scoreboard. A new research paper from Valletta Software Development, co-authored by Egor Kaleynik, reframes technical debt as a strategic risk with measurable financial, operational, and ESG consequences for SaaS businesses. It is no longer a backlog item. It is a board-level liability with a quantifiable carrying cost.
Key takeaways
- Proactive debt management cuts cumulative remediation costs by 52% across the 27 SaaS case studies analyzed.
- Teams that refactor on a fixed cadence report 2.3x fewer production incidents than reactive teams.
- More than 64% of technical debt is introduced before the first production deployment, meaning the cost of waiting compounds fastest in the months right after a launch.
- Untamed debt inflates cloud waste by up to 40% and shows up directly in valuation discount rates during M&A diligence.
- Algorithmic and ESG-linked debt are the two newest blind spots in AI-driven systems, and the hardest to detect with traditional static analysis tools.
Why technical debt is now a boardroom issue
For two decades, technical debt sat in the same drawer as code style and unit test coverage. Engineers cared, finance did not. That separation no longer holds. Three forces have moved the conversation upstairs.
First, investor due diligence now treats engineering health as a leading indicator of growth. Code Climate, SonarQube, and similar scanners are routinely included in technical due diligence checklists, and a poor result shifts deal multiples. Second, regulators have started naming software quality in compliance frameworks, from the EU AI Act to ESG disclosure rules covering data center power use. Third, cloud bills make waste visible in a way that on-prem infrastructure never did. A bloated query plan or a leaky cache no longer hides in a depreciation line. It shows up in the next AWS invoice.
The result is that CTOs are being asked to defend technical roadmap decisions with the same rigor a CFO defends working capital. The Valletta paper provides the framework to do that.
The five-part taxonomy of technical debt
Most teams talk about technical debt as a single bucket. The research splits it into five categories, each with different detection methods and different remediation costs.
- Code debt. The classic category: duplication, dead branches, untyped boundaries, and tests that no one trusts. Detected by static analyzers and lint pipelines. Cheapest to fix in the same sprint it was introduced; ten times more expensive a year later.
- Architecture debt. Boundary violations, hidden shared state, services that should not be services. Static tools rarely catch this. It surfaces during scaling events, regional failovers, and major version migrations.
- Algorithmic debt. Inefficient or non-deterministic logic in ML and data pipelines. New category. Hard to detect because the system still produces answers; the answers are just slow, biased, or expensive.
- Environmental debt. Infrastructure-as-code drift, oversized instances, idle GPU clusters, redundant snapshots, and forgotten dev environments. Visible in cloud cost reports, invisible to engineers.
- Organizational debt. Tribal knowledge, undocumented runbooks, on-call rotations that only one person can run. Compounds the fastest during attrition cycles.
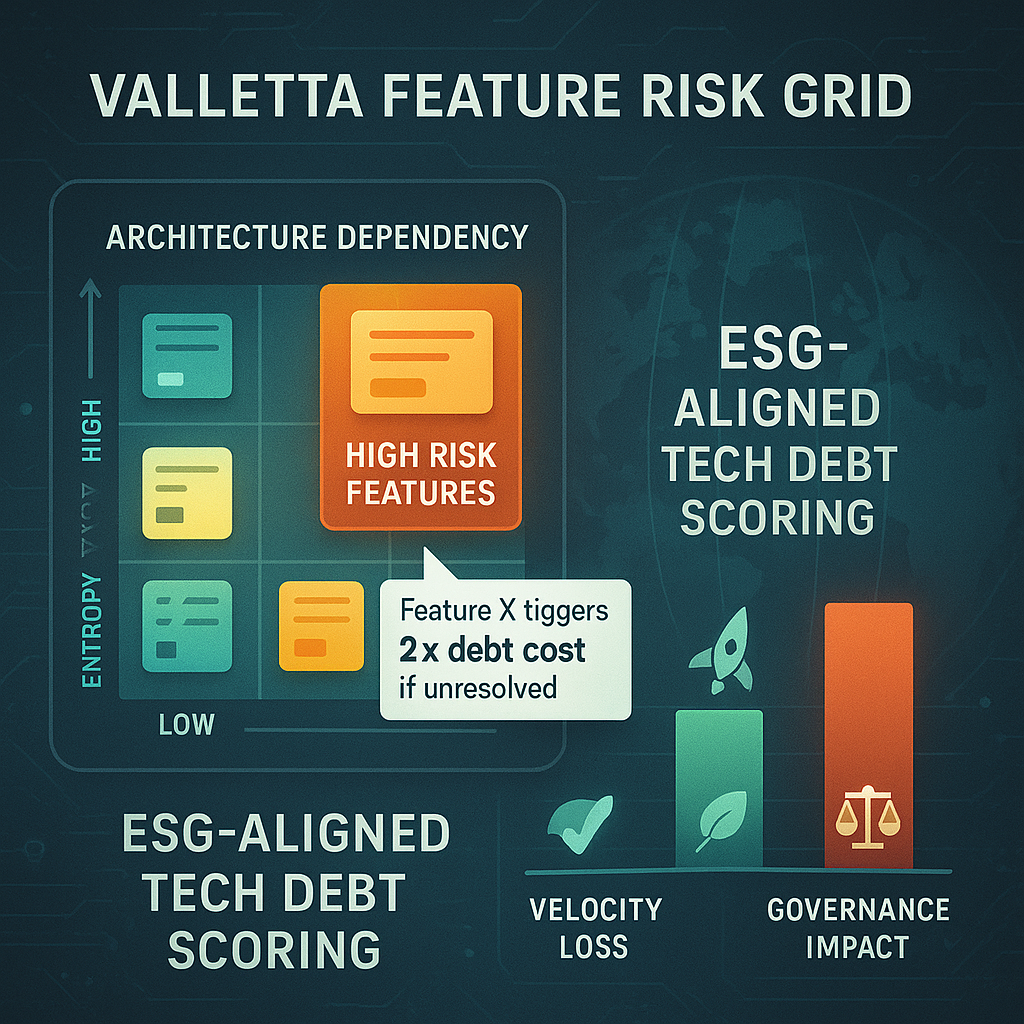
Treating these five as separate budgets, with separate owners, is how mature SaaS organizations turn a generic complaint into a tracked liability. Our Feature Risk Grid takes this taxonomy and assigns each new feature an explicit debt forecast before it ships.
The real costs, with numbers
The paper analyzes 27 SaaS case studies across FinTech, healthcare, and B2B workflow automation. Three patterns hold across every vertical we studied.
- Cumulative remediation cost grows month over month at 4 to 7%. Treat that as the carrying interest rate on the debt principal. After 18 months of inaction, the cost to fix the original issue can double.
- Production incident rate correlates inversely with refactoring cadence. Teams that allocate 15% of sprint capacity to refactoring report 2.3 times fewer incidents than teams that allocate zero. The breakeven point is around 8% capacity.
- Cloud infrastructure waste peaks during the 12 to 18 months after the first production launch. Most teams scale infrastructure to handle peak unknowns, then forget to right-size. Up to 40% of the cloud bill in this phase is recoverable through a focused environmental debt sweep.
These numbers are not unique to Valletta. They align with public research from McKinsey on tech debt and tech equity and with the long-running Atlassian DevOps research. What the paper adds is a SaaS-specific cost model that ties each category back to a P&L line.
Where debt comes from: 64% appears before the first deploy
The most counterintuitive finding in the research: most technical debt is created before any user touches the product. The pressure to ship a v1 forces shortcuts in data model decisions, authentication boundaries, and integration patterns that quietly compound for years.
Three discovery-stage practices reduce that 64% number meaningfully:
- A real discovery phase with an explicit data model lock. Our standard discovery engagement runs 40 to 173 hours depending on project size and cuts post-launch debt by roughly half.
- Architectural decision records (ADRs) for any choice that affects more than one service. Cheap to write, expensive to skip.
- A "no debt without a ticket" rule on the first three sprints. Anything skipped gets a backlog item with an explicit interest-rate estimate. This sounds bureaucratic; it ends roughly 80% of "we'll fix it later" debt that never gets fixed.
How to quantify and forecast technical debt
Quantifying debt is the step that turns it from a complaint into a board-ready metric. The paper recommends a two-stage approach.
Stage one: principal estimate. For each known debt item, estimate the engineer-hours required to fix it at today's complexity. Multiply by your loaded engineer cost. This is the principal balance.
Stage two: forecast with Monte Carlo. Use a Monte Carlo simulation to model interest accrual under different scenarios: no action, 10% sprint capacity, 20% sprint capacity. The simulation pulls from your historical incident data, your release frequency, and your team turnover rate. After 1,000 iterations you get a probability distribution of remediation cost over the next 12 months under each policy.
To prioritize within the backlog, the paper recommends WSJF (Weighted Shortest Job First) using cost of delay over job size. Cost of delay includes both customer value and the interest rate of leaving the debt in place. This turns the question of "do we ship a new feature or pay down debt" into a numerical comparison.
Tooling: where SonarQube ends and Compass begins
No single tool covers all five categories. The paper compares three options that, used together, give you reasonable coverage.
- SonarQube covers code debt well. Static analysis, hotspots, duplication, complexity metrics. Limited value beyond the code category.
- Atlassian Compass targets architecture and organizational debt. Component scorecards, ownership maps, on-call rotation visibility. Weaker on environmental and algorithmic categories.
- The Valletta Feature Risk Grid sits on top of both, adding an explicit forecast layer per feature and a board-ready dashboard tying engineering metrics to financial impact.
The recommended stack: SonarQube for code, Compass for architecture and organizational, cloud cost tooling (CloudHealth or native AWS Cost Explorer) for environmental, and the Feature Risk Grid as the consolidation layer.
From engineering metric to investor signal
Once you can quantify debt, three audiences inside and outside the company start to care.
- The board wants to see debt as a percentage of total engineering capacity, with a trend line. Anything trending up for two consecutive quarters is a flag.
- Investors and acquirers ask for the principal estimate as part of technical due diligence. A clear number with a clear remediation plan reduces the discount they apply to valuation.
- Talent notices. Senior engineers leave teams with high invisible debt, because they pay for it nightly. Visible, tracked debt with a real reduction plan is a recruiting and retention signal.
What to do this quarter
Three concrete moves a CTO can make in the next 90 days, without buying any new tooling:
- Categorize the top 30 items in your refactoring backlog using the five-part taxonomy. The distribution alone will tell you where your hidden weight sits.
- Pick a fixed refactoring cadence: 10 to 15% of sprint capacity is the sweet spot for most B2B SaaS teams. Allocate it; do not negotiate it sprint by sprint.
- Pull last quarter's cloud bill, find the top three line items, and ask one engineer to spend a focused week reducing each one. The environmental debt category usually pays for itself in the first sweep.
If you want the full research, including the Monte Carlo formulas and the comparison tables: read the full paper, or get in touch with co-author Egor Kaleynik to talk through how to operationalize the framework for your SaaS architecture. Related reading: Feature Risk Grid, Scope Creep Management, SaaS Tech Stack Selection.
Frequently asked questions
What is the difference between technical debt and bad code?
Bad code is a quality problem in the moment. Technical debt is a deliberate or accidental trade-off whose cost compounds over time. Bad code might be fixable in one PR; technical debt has interest, and the interest is paid by future engineering capacity, infrastructure cost, or incident response time.
How much engineering capacity should we spend on technical debt?
For most B2B SaaS teams, 10 to 15% of sprint capacity on a fixed cadence is the sweet spot. Below 8%, incident rates rise. Above 25%, feature delivery suffers without proportional quality gains, because not all backlog items have equal interest rates.
Can technical debt be measured in dollars?
Yes. Estimate the engineer-hours required to remediate each known item at today's complexity, multiply by loaded engineer cost, then add a Monte Carlo simulation of interest accrual over the planning horizon. The output is a probability distribution of total remediation cost, suitable for board-level reporting.
Why does ESG matter for technical debt?
Environmental debt has a direct carbon and energy footprint through cloud waste. As ESG disclosure rules expand, especially in the EU, oversized infrastructure and inefficient algorithms become reportable items. ESG-aware investors increasingly include a software efficiency score in their evaluation models.
Do AI-driven systems have unique technical debt?
Yes. Algorithmic debt covers non-deterministic model behavior, stale training data, biased prompts, and brittle prompt chains. Static analyzers do not catch any of it. The detection methods are A/B testing, output sampling, and continuous evaluation pipelines, all of which need to be built as first-class infrastructure rather than retrofitted later.